
The Architecture of Precision Analysis.
NewKorava provides the structural knowledge required to navigate high-density financial data. We focus on transforming complex market analysis platforms into streamlined environments for professional decision-making.
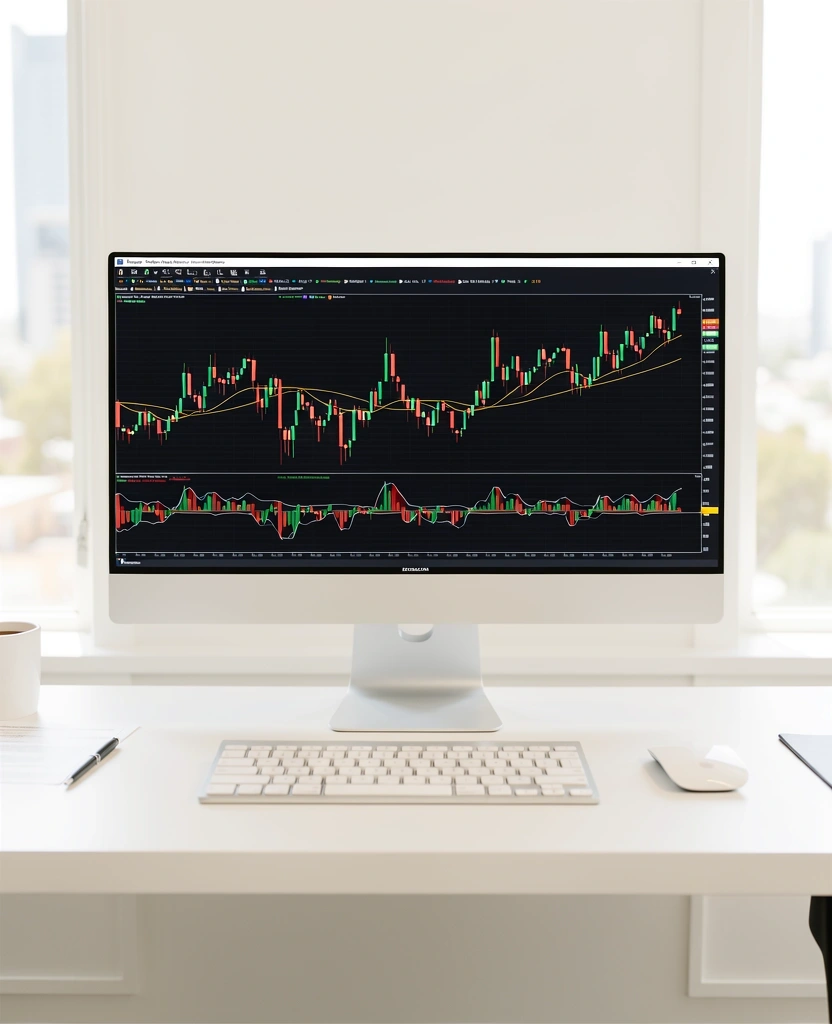
The TradingView Integration
At NewKorava, we pivot our educational framework around TradingView due to its dominance in global market research. Understanding this tool isn't just about drawing lines; it's about backend data management and multi-timeframe synchronisation.
Visual Logic
Customising script-based indicators for clarity.
Data Sourcing
Connecting exchange-specific feeds for AU markets.
Multi-Asset Correlation
Successful market analysis requires the ability to overlay disparate datasets. We teach analysts how to use the comparison engine to track the AUD/USD pair against commodity benchmarks like iron ore and gold. This allows for a macro perspective that single-chart analysis lacks.
- Relative Strength Comparison
- Ratio Chart Generation
- Spread Trading Visualization
- Correlation Coefficients
Alert System Optimization
Eliminate screen-watching fatigue. Our methodologies focus on building complex, multi-conditional alerts that trigger only when technical confluence is met. This discipline is essential for modern finance professionals managing multiple portfolios.
- Server-side Alert Management
- Custom Pine Script™ Alerts
- Webhook Integration
- Event-driven Notification Flows
Backtesting & Strategy Tester
Proof through data. Learn to quantify your analysis by running historical simulations. Understanding the Strategy Tester in TradingView allows you to vet techniques before applying them to live Australian market environments.

Technical Analysis is Documentation, Not Prediction.
The objective of mastering market charting tools is to create a repeatable, objective record of price behavior. We move away from the "magic indicator" myth and toward surgical data visualization.
Established 2026 // NewKorava Methodology
Core Tool Modules
Charting Hygiene
Establishing clean chart layouts, managing object layers, and utilizing hotkeys to maximize speed during active trading sessions.
- • Syncing layouts across devices
- • Global drawing tool settings
- • Template management strategies
Script Overview
Introduction to Pine Script™—the engine behind TradingView's custom volatility indicators, community scripts, and automation.
- • Reading existing script logic
- • Safe community script vetting
- • Basic modification principles
Fundamental Aggregation
Learning to pull financial statement data, economic calendars, and news sentiment directly into your technical workspace.
- • Revenue & EPS chart overlays
- • Economic event automation
- • Sector-wide performance heatmaps
Frequently Asked Questions
Ready to Refine Your Analysis?
Join our next intake on April 12, 2026. Limited capacity to ensure thorough mentoring for every participant.